
Workplaces in Australia are safer than they once were, but as professionals committed to wellbeing know, there’s always more to be done. Using data from Safe Work Australia’s Key Work Health and Safety Statistics Australia 2025 report, this article will explore key health and safety statistics, highlight the industries with the highest injury and fatality rates, compare recent years, and identify effective strategies to reduce incidents and enhance safety culture.
Overall Picture: Injuries and Fatalities
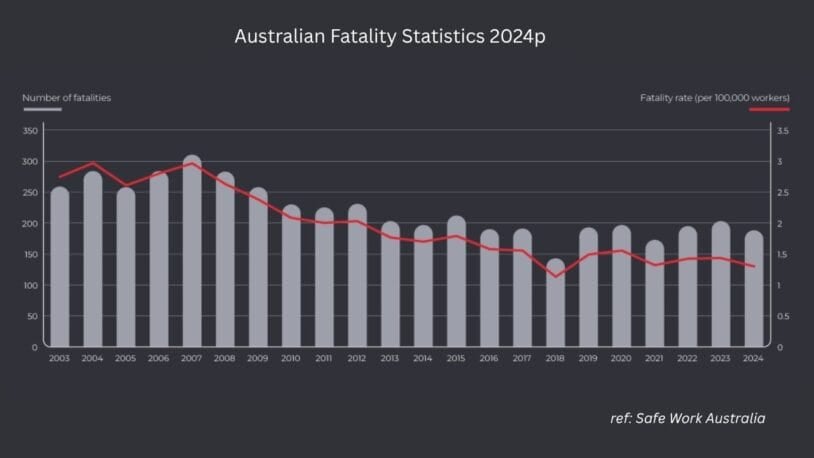
Across Australia, the latest data tell a mixed story in terms of progress and remaining risk in work health and safety.
-
In 2024, 188 workers died from traumatic work-related injuries – equivalent to a rate of 1.3 deaths per 100,000 workers.
-
That fatality rate is a 24% decline since 2014, when the rate was 1.7 per 100,000.
-
On the injury front, in 2023-24 (preliminary), there were 146,700 serious workers’ compensation claims (i.e., at least one week off work) across Australia.
-
The incidence rate of such serious claims is 10.9 per 1,000 jobs, with a frequency rate of 6.8 per million hours worked.
-
The injury-or-illness rate (via the ABS Work-Related Injuries Survey) shows about 3.5% of workers experienced a work-related injury or illness in the previous 12 months.
In short, fatalities are down (which is good), but serious injury and illness claims remain high and stable, and a significant portion of harm is concentrated in certain industries. For businesses and safety professionals, the message is clear – ongoing vigilance, targeted strategies, and training remain critical.
Industries With the Highest Risk
The data show that harm is not evenly distributed, as some industries carry disproportionate risk for fatalities and serious injury.
Fatalities by Industry (2024)
-
The industry with the highest fatality rate is Agriculture, forestry and fishing, at 13.7 fatalities per 100,000 workers.
-
Transport, postal and warehousing recorded 7.4 fatalities per 100,000 workers.
-
Construction had 37 fatalities, a rate of 2.8 per 100,000 workers.
-
In terms of counts, Transport had 54 fatalities (29% of all worker fatalities), Agriculture 44 (23%), and Construction 37 (20%).
These headline numbers tell us which sectors are most dangerous in terms of death risk. For organisations in those industries, risk is especially high and demands systematic action.
Serious Claims by Industry (2023-24 p)
Looking at serious workers’ compensation claims:
-
In the division of Agriculture, forestry and fishing, the serious claims frequency rate was 10.0 per million hours worked – which is 46.9% higher than the overall industry’s average of 6.8.
-
Health care and social assistance accounted for 29,100 serious claims (19.9% of all claims) with a frequency rate of 9.4 per million hours.
-
Construction: 17,600 claims (12.0%), frequency rate 9.3 per million hours.
-
Manufacturing: 14,800 claims (10.1%), frequency rate 9.4.
Thus, while the fatality risk is heavily in Agriculture and Transport, serious injuries (which might not kill but still have a heavy impact) are spread across more industries, especially where physical demands are high or risk exposures are frequent.
Read our article, Top Workplace Hazards in Construction.
Trends: How do These Figures Compare With Previous Years?
It’s helpful not only to look at static numbers, but also to see whether things are improving (or deteriorating).
-
The worker fatality rate of 1.3 per 100,000 in 2024 is slightly below the 5-year average (2020–24) of 1.4.
-
Over the decade since 2014, the reduction is 24%, so there has been meaningful improvement. But the rate has “remained relatively steady in recent years.”
-
On the serious claim side, compared with 2013-14, the count of serious claims is up by 37,600 (an increase of 34.5%).
-
The frequency rate of serious claims (which adjusts for hours worked) increased by 12.6% over the same period.
-
For the mechanism of incident: in 2023-24 p, 84% of serious claims involved body stressing, falls/slips/trips, being hit by moving objects, or mental stress.
-
Moreover, claims for mental health conditions have grown significantly: they now account for 12% of serious claims (2023-24 p), up 14.7% year-on-year and up 161% over 10 years.
So, while fatalities are moving in the right direction, serious injury/illness remains stubbornly high and, in some cases, is increasing. For safety professionals, this means there is less room for complacency. Focus must broaden beyond just fatality prevention to major injury/illness prevention.
Read our article, 8 Workplace Hazards That Can Kill.
Strategies to Increase Safety and Reduce Incidents
Given these health and safety statistics, what can organisations and safety leaders do? Here are key strategies grounded in the data:
A. Focus on high-risk industries and mechanisms
Because harm is concentrated: for example, vehicle incidents account for 42% of fatalities in 2024, and falls from a height for 13%.
Thus:
-
In sectors like Agriculture and Transport, strengthen management of vehicle risks, plant/machinery use, single-vehicle incidents, etc.
-
For falls/slips/trips: engage at the design stage (work at height controls, guardrails, harnesses, safe access).
-
For body stressing – ergonomics, manual-handling training and equipment, job design.
-
For mental health: recognise that claims are increasing, so psychosocial risk management (bullying, workload, organisational culture) must be part of any safety program.
B. Build a strong safety culture and leadership
Culture and leadership underpin performance. Effective safety programs have visible leadership commitment, clear safety policies, and systems where hazards are identified and controlled continuously.
-
Use risk assessments that are industry-specific and reflect those high-risk sectors (e.g., Agriculture, Transport, Construction).
-
Encourage hazard reporting and near-miss reporting—this helps prevent serious incidents.
-
Have active safety committees or safety champions in high-risk areas.
C. Use training strategically
Training is a core lever to improve safety outcomes. In light of the statistics:
-
Provide industry-specific hazard training for the highest-risk industries. For example, in Agriculture: training for quad-bike use, machinery, remote-work risks, and plant transport. In Transport: driver fatigue, load-securing, vehicle inspection, single-vehicle risk.
-
Encourage manual-handling and ergonomics training across high claims industries (body stressing is 34.5% of serious claims).
-
Deliver work-at-height and fall-prevention training, especially in construction and manufacturing.
-
Provide bullying, harassment, work-pressure and mental-health awareness training, given that mental-health claims take far longer to recover. For example, the median time lost for mental-health claims is nearly 5 times that for other injury/disease claims.
-
Use refresher training, scenario-based exercises and competency verification to ensure training is not “tick the box” but effective.
This is where TIS Training can help! Take a look at our comprehensive library of courses that provide hazard training, manual handling, fall from height, bullying, harassment, burnout and mental health literacy. Contact us to learn more about how you can access all of these courses and more to use on the TIS LMS or your own.
D. Monitor & measure performance using data
Effective safety programmes use leading and lagging indicators. Use frameworks to track:
-
Near misses, hazard reports, corrective actions (leading).
-
Frequencies of serious claims, time lost, and specific mechanism types (lagging).
-
Compare your organisation’s metrics with industry benchmarks (e.g., frequency rates by industry division from Safe Work Australia).
-
Regularly review your training uptake, competency assessments, and correlate with incident trends.
E. Continuous improvement
Because the data show improvements in some areas but stagnation or worsening in others, continual improvement is essential.
-
Conduct periodic audits of risk controls, especially in high-risk sectors.
-
Review incident investigations to identify systemic issues (not just individual errors).
-
Engage workers in safety design: they’re often the ones most exposed to the hazards.
-
Adapt to new or evolving hazards (e.g., remote-site work, new plant machinery, psychological risks).
Read our articles, The Role of Supervisors in Preventing Fall Injuries and The Critical Role of a Supervisor.
Why These Statistics Matter
Understanding the latest health and safety statistics is not just about numbers; it’s about prioritising action where it matters.
-
These statistics illustrate where harm is concentrated: which industries, which mechanisms, which age-groups. For example, older workers (55-64 and 65+) have the highest serious claims frequency rates (9.5 and 10.0 per million hours worked, respectively).
-
They highlight that while fatalities have declined, serious injury/illness remains a major cost—financially, humanely, operationally. For example, serious claims have risen 34.5% in count over 10 years.
-
They justify investment in safety: fewer injuries means fewer lost work weeks, fewer compensation payouts (median compensation for serious claims was $16,300; for mental health claims alone median was $67,400).
-
They show that training, culture, hazard control, and measurement all combine to move the dial.
-
They provide the data that can inform your risk profile, your safety plan, your training calendar, and your budget.
6. Final Thoughts
When you search for “health and safety statistics”, you’ll find numbers—but the value lies in what you do with them. The latest Safe Work Australia data make three key messages clear:
-
Risk is concentrated: certain industries (Agriculture, Transport, Construction, Health care) carry higher rates of fatalities or serious injuries.
-
Mechanisms matter: vehicle incidents, falls, body stressing, being hit by moving objects, and mental-health conditions dominate.
-
Training and risk management must be tailored: one-size-fits-all won’t cut it.
If your organisation is committed to raising safety performance, use these statistics to benchmark, to identify priority hazards, and to drive your training and culture initiative. Set measurable goals (e.g., reduce manual-handling claims by X% in 12 months), report to leadership regularly, and maintain and deepen your focus. The data show we’ve made progress, but there’s still more to do. Every reduction in harm, every worker who returns home safely, is meaningful.